RESEARCH SPOTLIGHT
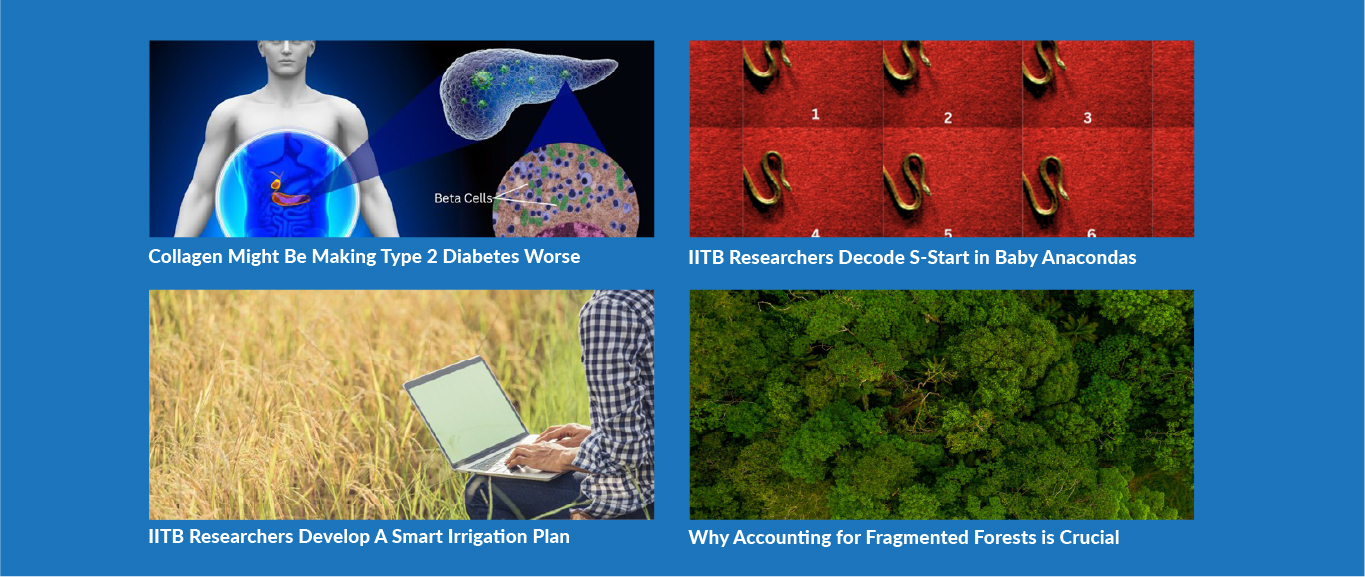
1. Collagen Might Be Making Type 2 Diabetes Worse, Finds Study
The following article was originally written by Manjeera Gowravaram and published here.

Type 2 diabetes affects more than 500 million people worldwide, a number expected to grow significantly in the coming decades, posing a major public health crisis. This growing health problem is caused by a mix of lifestyle, genetics, and complex biological mechanisms that drive the disease progression. At the cellular level, the disease is marked by the progressive dysfunction of pancreatic β-cells, which are responsible for producing insulin—a hormone essential for regulating blood sugar levels. In type 2 diabetes, either not enough insulin is produced, or the body’s cells become less responsive to it, resulting in high blood sugar levels.
Along with insulin, another hormone called amylin helps control blood sugar after meals. The same β-cells in the pancreas release both insulin and amylin. In diabetes, when the body tries to release more insulin, it also ends up making more amylin. However, unlike insulin, amylin molecules tend to misfold (form a structure that differs from the one required for normal functioning), especially at high concentrations. Misfolded amylin tends to stick together, forming clumps that are toxic to cells. Previous research has shown that these clumps can damage the outer layer of cells, block the movement of nutrients, and even cause cell death. However, it is unclear what factors in the tissues of people with diabetes promote this clumping.
In a recent study published in the Journal of the American Chemical Society, researchers from the Indian Institute of Technology Bombay (IIT Bombay), and collaborators from the Indian Institute of Technology Kanpur (IIT Kanpur), and the Chittaranjan National Cancer Institute (CNCI), Kolkata have identified an important missing link: fibrillar collagen I, a major component of the extracellular matrix. “Every tissue is composed of cells and an acellular component, the extracellular matrix. It is the matrix that holds together all cells and gives shape to organs,” explains Prof. Shamik Sen from the Department of Biosciences and Bioengineering at IIT Bombay, who led and oversaw the project.
In diabetic pancreatic tissue, the protein collagen I, that is found abundantly in connective tissues like skin and bones, becomes more abundant. And now, from the study, it is found to serve as a platform that accelerates amylin aggregation, which damages the insulin-producing β-cells and makes amylin more toxic. This damage reduces the body’s ability to control blood sugar, pushing individuals closer to full-blown diabetes.
To explore how collagen I influences amylin aggregation, the team used a range of biophysical techniques. Led by Prof. Ashutosh Kumar from the Department of Biosciences and Bioengineering, IIT Bombay, the team synthesised the human amylin. They monitored its behaviour in the presence of fibrillar collagen I using suitable tools. They used surface plasmon resonance to see how strongly the proteins stick to each other, atomic force microscopy to look at the adhesion strength between amylin and collagen I, thioflavin T fluorescence to track how quickly the clumps form and NMR spectroscopy to find out which parts of the proteins are interacting.
The experiments showed that amylin binds directly to collagen I fibrils, with aggregation occurring significantly faster in its presence. “It almost seems that the amylin completely physically coats the collagen surface forming stable aggregates that are more difficult for cells to clear. That was a very striking finding for us,” says Prof. Sen. “Rather than aggregating in isolation, amylin appears to use the collagen fibres like train tracks, accelerating its accumulation and increasing toxicity to nearby cells,” adds Prof. Sen. Molecular dynamics computer simulations, performed by Prof. Prasenjit Bhaumik’s group from the Department of Biosciences & Bioengineering at IIT Bombay, supported the finding that fibrillar collagen I accelerates amylin aggregation.
To understand how this interaction plays out in actual biological tissues, Prof. Sen collaborated with Prof. Hamim Zafar and Prof. Sai Prasad Pydi from IIT Kanpur, and Dr. Sankhadeep Dutta from CNCI. They examined the pancreatic tissue from diabetic mice and also analysed single-cell data from human pancreatic tissue. They found that as diabetes progressed, both collagen and amylin levels increased simultaneously, indicating that they were closely linked. At the same time, there is disruption in the structure of the pancreatic islets, which are groups of cells where the insulin-making β-cells live.
To test how amylin and collagen together affect cells, Prof. Sen’s lab conducted experiments using lab-grown insulin-making β-cells. They grew these cells on a gel made of collagen that contained amylin and checked how healthy the cells were. Compared to cells grown on substrates without collagen and amylin, cells grown with amylin and collagen showed increased cell death, higher stress from harmful molecules (oxidative stress), made less insulin, and activated various cell death pathways. These findings highlight the importance of the extracellular matrix environment (like the collagen) in enhancing toxicity.
This study also helps explain why some diabetes treatments, that mainly focus on processes inside the cells may not be very effective in halting disease progression. “Unless we disrupt this interaction between amylin and collagen, we may not be able to fully eliminate the toxic microenvironment in the pancreas,” Prof. Sen adds.
The research team is now working to develop cryo-electron microscopy (cryo-EM) models of how amylin and collagen interact, aiming to guide the development of new drugs. They are also exploring ways to repair the pancreas, such as transplanting islets with support from 3D structures that mimic the natural environment, to restore β-cell function before significant damage occurs.
*********************************************************
The original academic article, titled Faster Amylin Aggregation on Fibrillar Collagen I Hastens Diabetic Progression through β-Cell Death and Loss of Function was written by researchers from IIT Bombay and published in the Journal of the American Chemical Society, Vol 147/Issue 19.
The original paper can be found here.
2. Researchers Model the Unique S-Start Motion that Newborn Yellow Anacondas Use to Escape Threats

Progression of the S-start in a young yellow anaconda.
Image Credits: Authors of the study. Charles, N., Chelakkot, R., Gazzola, M. et al. Topological dynamics of rapid non-planar gaits in slithering snakes. Nat. Phys. 21, 856–860 (2025).
The following article was originally written by Mr. Dennis Joy and published here.
The team built a computational model that revealed how a simple force travelling along the snake can replicate the complex movement of the S-start motion, revealing deeper insights and hinting at evolutionary connections.
From mesmerising slithers and smooth gliding to powerful constrictions and strange wiggles, limbless animals, like snakes and worms, have evolved a variety of ways to navigate the world. Snakes, undoubtedly the most iconic of the group, have especially displayed extraordinary versatility in their movements, able to climb, crawl, and even glide. Snake movements have been broadly categorised into three types: the straight-line rectilinear crawl, the wavy undulatory motion, and the distinctive sidewinding often seen in deserts. However, not all snake movements fit neatly into these categories, and it’s becoming clear that this traditional list doesn’t cover all the tricks snakes have up their sleeves.
In one such recent event, researchers from the University of Massachusetts Lowell and Washburn University in the USA were studying newborn Yellow Anacondas when they noticed a never-before-recorded movement by the snake, called an S-start. “Whenever the snakes were handled or approached during the experiments, they consistently employed a non-planar, transient locomotion to move away from the researcher”, explains Prof Raghunath Chelakkot, an associate professor at the Indian Institute of Technology (IIT) Bombay, who was part of the team that studied this new snake movement.
Simply put, the snake raises its head slightly and coils itself into an ’S’ shape. This S-curve then travels along the snake to its tail, straightening the snake. This movement of the S curve, in turn, propels the snake forward, away from the approaching perceived danger. “We call it an `escape gait’ as lifting the body is not energetically optimal for snakes, and this locomotion aims to get away from harm’s way as quickly as possible,” adds Prof Chelakkot. The S-start is referred to as a transient motion, meaning the snake cannot utilise it for continuous movement. Once it lands, the snake must reload the S spring to repeat the energy-consuming process until it has covered a safe distance.
To study this new motion, Prof. L. Mahadevan from Harvard University, USA, along with Prof. Chelakkot from IIT Bombay, Dr. Nicholas Charles, from Harvard University, Prof. Mattia Gazzola from the University of Illinois at Urbana-Champaign, USA, and Prof. Bruce Young from Kirksville College of Osteopathic Medicine, USA, turned to computational modelling. They built a model that treated the snake’s body as a flexible, active filament, allowing them to simulate the S-start and determine the underlying physics.
Modelling the squishy organic material of the snake as elastic filaments is a simplification. However, doing so can reveal the forces involved in this complex manoeuvre. According to Prof Chelakkot, “the primary modelling challenge is to identify the internal force and torque (twisting force) distribution that replicates the complex posture displayed by the snake during locomotion.”
To their surprise, the complex movement was easily replicated with just three localised torque pulses oriented in three directions, travelling along the snake towards the tail. “The initial posture during the S-start motion is complicated since it involves in-plane (on the floor) and out-of-plane (lifted off the floor) bending of the snake’s body. It was a surprise that a relatively simple torque distribution on an elastic filament could reproduce a complicated posture displayed by the snake during locomotion,” remarks Prof Chelakkot about the finding.
The model also allowed them to calculate the weight-to-muscle torque ratio, which shows how heavy the snake can get before it can no longer perform the S-start. This explains why only juvenile yellow anacondas display this escape gait. The snake needs enough muscle strength to lift and twist parts of its body off the ground against gravity, while also generating the necessary force to propel itself. Lighter, more muscular juvenile anacondas possess the ideal combination of body weight and muscle power to achieve this. The model enabled the researchers to map out a phase space – a map showing the conditions, such as body weight and muscle strength, under which the S-start is possible. Interestingly, when the researchers repeated the S-start motion periodically, it naturally led to another unique type of snake movement, known as sidewinding. Sidewinding motion is primarily observed in desert-dwelling snakes, such as the sidewinder rattlesnake or the horned viper. The natural progression of the escape gait of the Yellow Anacondas into the sidewinding motion might hint at an evolutionary connection.
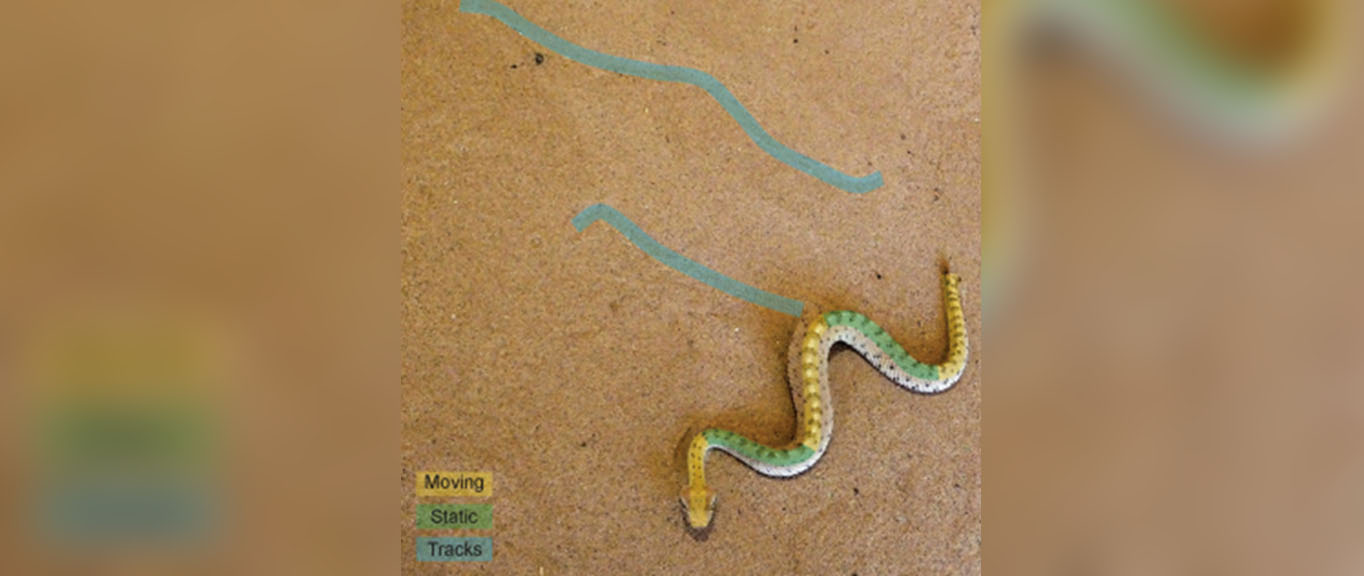
Neonate sidewinder sidewinding with tracks labelled:
Image Credit: By HCA – Own work via Wikimedia commons
“The structural similarities between S-start and sidewinding indeed hint at such a possibility. A more recent report on the lasso motion tree-climbing snakes also appears to show a variant of S-start motion. However, further studies need to be done in this direction to make any concrete claims on a common evolutionary pathway,” says Prof Chelakkot.
By identifying and modelling the S-start, researchers are filling the gaps in how we classify and understand the full range of snake locomotion. The work also highlights the importance of studying transient modes, which are quick, temporary movements, such as escape lunges, that are crucial for survival in the wild. Understanding biomechanical secrets of the S-start could also provide blueprints for developing next-generation robots capable of complex, non-planar movements.
Prof. Chelakkot and his team are already examining some of these applications. “One interesting direction will be extending the elastic filament framework to other types of limbless locomotion and addressing the diversity displayed by the large class of limbless species, such as snakes, worms, etc. The long-term goal is to make precise quantitative predictions using elastic theory, allowing numerical models to be used for synthesising limbless robots,” he concludes.
*********************************************************
The original academic article, titled Topological Dynamics of Rapid Non-Planar Gaits in Slithering Snakes was written by researchers from IIT Bombay and published in the journal Nature Physics.
The original paper can be found here.
3. Researchers Develop A Smart Irrigation Plan to Save 10-30% of Irrigation Water in Drought-Prone Regions

Image Credit: Freepix
The following article was originally written by Divyapriya Chandrasekaran and published here.
Researchers combine weather forecasts, satellite soil moisture data, and a computer simulation for efficient irrigation water management at district and sub-district scales.
Both water and money need to be managed wisely. When money in the bank is limited, people spend it prudently. Farmers in a drought-prone area face a similar situation with water. Daily, they must plan for irrigation. The rains are unpredictable, and they can’t waste the already diminishing groundwater. If farmers know beforehand how much water they will receive through rainfall in the coming weeks, they can plan their irrigation wisely, helping crop growth and conserving groundwater at the same time.
Researchers from the Department of Civil Engineering and Centre for Climate Studies at the Indian Institute of Technology Bombay (IIT Bombay) and the Indian Institute of Tropical Meteorology, Pune (IITM Pune), have developed a method that addresses the same issue. In their recent study, they combined extended-range weather forecasts (1 to 3 weeks ahead), generated by IITM, Pune, satellite soil moisture data processed by IIT Bombay, and a computer model, to predict the amount of irrigation water needed up to three weeks, on a district and sub-district scale.
Earlier, during their pilot study in Nashik, Maharashtra, the researchers found that some well-to-do grape farmers used local soil moisture sensors. If the soil moisture sensor detects soil dryness, the farmers irrigate the grape farms. If the irrigated grape farms receive rainfall, the irrigation water gets wasted. To avoid water wastage in already shrinking groundwater locations, the authors suggested including weather forecasts.
“During our pilot study in Nashik, we included local weather forecasts in the soil moisture data and showed farmers that groundwater can be conserved up to 30 %. We initially predicted up to one week (short-range) ahead,” shares Prof Subimal Ghosh, from IIT Bombay.
During this short-range prediction, researchers fed weather forecast and soil moisture data into a computer model that checks the possible amount of rain, the water capacity of the soil, and the water requirements of each crop. The computer model provides details on when and how much water would be needed for the crops. If the model predicts no rainfall in the coming days, it will suggest irrigating crops now. On the other hand, if the model predicts rainfall that can increase the soil moisture, it might suggest avoiding irrigating crops. Their findings showed that the grape farms could consume 10 to 30 % less water without compromising the yield. This approach prevents overwatering the crops and saves water.
The team extended their methodology in 12 sub-districts of Bankura, a drought-prone district in West Bengal. They considered five major crop varieties, i.e. maize, wheat, sunflower, groundnut, and sugarcane, a combination of cereals, oil seeds, and cash crops. These widely grown crops have varied growth patterns and water requirements. Each crop variety has a varied root zone depth, the extent below the soil surface to which a crop’s roots reach for water and nutrients. It is essential to retain soil wetness up to this level. When plants do not get enough water, they sense the water stress. To conserve water, they close stomata, the tiny pores on the leaf surface, meant for the exchange of gases.
The researchers used global soil maps and integrated satellite and field data to include soil moisture data such as root zone depth, soil texture, porosity, water-holding capacity, water conductivity, and stomatal closure. The researchers collected water consumption, monthly rainfall, root depth, and irrigation water requirement data from the Food and Agriculture Organisation (FAO) resource, IMD database, and IITM Pune.
“Our computer model depicts the natural process by which plants draw water from the soil, their adaptation during a water stress, and their response during a water balance after irrigation or rainfall,” says Prof Ghosh.
The study methodology acted as a real-time advisor for water management. The researchers used the computer model and validated it with actual soil, weather, and crop requirements data for all the crops for the upcoming three weeks. By implementing this plan, the crops can consume less than 10 to 30% of the water usage compared to the traditional irrigation methods across all 12 sub-districts.
“We did not want to make the model very crop-specific, so we have developed more generalised equations. We used a very simple ecohydrological model that employed weather forecasts and soil moisture data, which can be adjusted based on the region and crops,” adds Prof Ghosh.
The extended-range weather forecasts can help in forecasting district-level water requirements and can assist water management. With the possibility of replicating across wide crop varieties and soil types, the approach aids in efficient water usage. “To expand this effort to other districts, we must convince the farmers that the model is beneficial. We are planning to discuss with farmers in villages to install a few sensors and develop an advisory system,” shares Prof Ghosh.
The study highlights how weather forecasting, remote sensing, and computer simulation can be joined together to assist farmers and water managers in effective irrigation management and reduce groundwater dependency.
*********************************************************
The original academic article, titled District to Subdistrict Scale Optimum Irrigation Water Management Planning at Multi-Week Lead Time was written by researchers from IIT Bombay and published in the Journal of Earth System Science.
The original paper can be found here.
4. Accounting For Fragmented Forests is Crucial for Effective Afforestation Planning
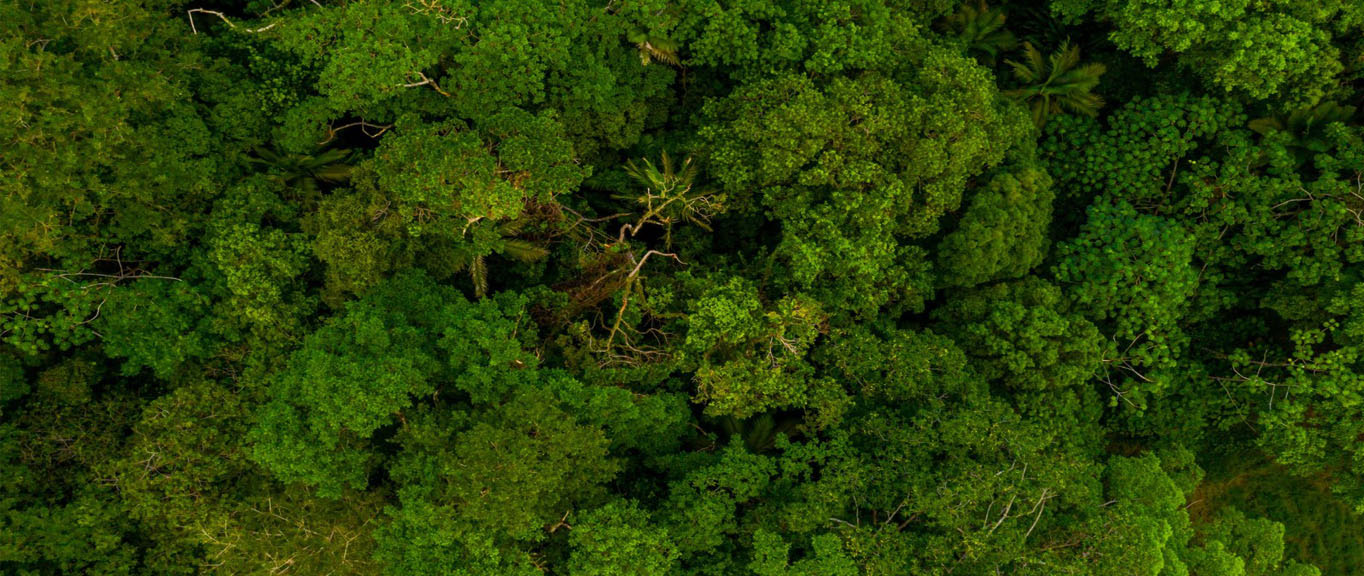
Image Credit: Freepik
The following article was originally written by Arul Ganesh SS and published here.
Forest gain from 2015 to 2019 is in fragmented patches, reveals a study conducted using a new framework designed by IIT Bombay and SASTRA Deemed University.
Large, continuous forests are ecologically healthy. They foster rich biodiversity, are resilient to natural and man-made disturbances and can self-regenerate. These unfragmented forests deliver long-term socio-economic benefits. In contrast, fragmented forests disrupt the movement and survival of plants and animals; for example, tigers need large, connected forests to hunt, breed, and survive without coming into conflict with humans. While the Forest Survey of India (FSI) and other independent studies regularly report on India’s gross forest cover, there has so far been no systematic framework to understand structural connectivity and monitor forest fragmentation across the country.
In a recent study, Prof. RAAJ Ramsankaran of IIT Bombay and his collaborators, Dr. Vasu Sathyakumar and Mr. Sridharan Gowtham of SASTRA Deemed University, have proposed a framework that uses remote sensing data and open-source digital tools to map forest connectivity at both the state and national levels. In addition to providing insights into how connected the forests are, the framework can also be used to analyse the impact of afforestation efforts, determine the resilience of different forest types to deforestation, and identify the states undergoing severe changes in forest cover.
A key aspect of this approach is its classification of forest landscapes into seven types, each with distinct ecological implications: cores, which are relatively large and intact forest habitats; bridges, which connect different cores; loops, which connect parts of the same core; branches, which are narrow extensions from cores; perforations, which are non-forest clearings within cores; edges, which form the outer boundary of cores; and islets, which are small, isolated forest patches. The study finds that cores are the most resilient to deforestation, while islets are the most vulnerable, often undergoing further fragmentation or loss within a short span of time. In this sense, afforestation activities that primarily result in the creation of islets may not meaningfully contribute to forest health or connectivity.
“Our resilience-based ranking offers a practical tool for policymakers,” says Prof. Ramsankaran. “Rather than treating all forest areas the same, it helps identify which morphologies are most vulnerable (like islets) and which offer long-term ecological value (like cores).” He adds that afforestation programmes such as CAMPA or the National Mission for a Green India can benefit by focusing on strengthening existing cores and building bridges between them, which could potentially yield better-connected, more resilient, and ecologically sustainable forests. The framework also has the potential to inform infrastructure planning by helping identify areas where connectivity is most at risk, thus supporting more scientifically informed decisions and reducing ecological disruption.
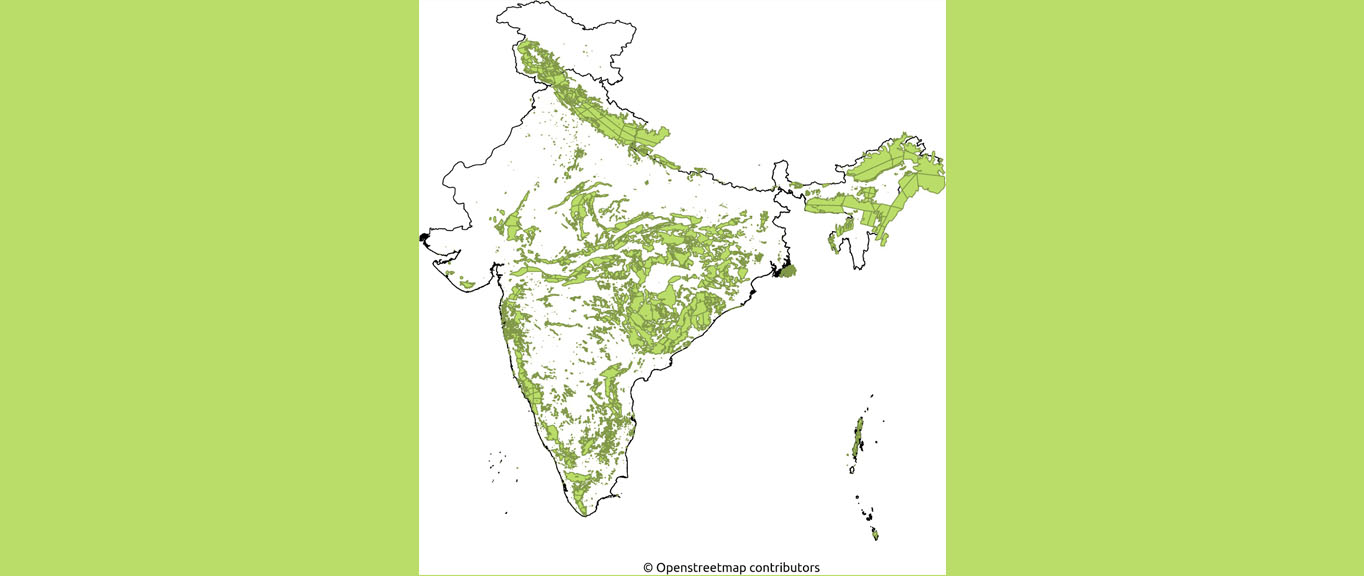
Indian forest cover map as of 2015.
Image Courtesy: Wikipedia
The framework relies on an image processing technique called Morphological Spatial Pattern Analysis (MSPA) to detect and classify the structure of forest landscapes. As part of the study, the researchers applied the analysis to digital forest cover maps of India for the years 2015 to 2019, obtained from the Copernicus Global Land Service (CGLS) Land Cover Map. Unlike most previous studies on forest cover, which report only net gains or losses, this study mapped forest loss and gain separately.
The results show that from 2015 to 2019, all states in India experienced a net loss in forest cover. Overall, India lost 18 square kilometres of forest for every 1 square kilometre gained. Nearly half of the 56.3 sq. km. of gross forest gain occurred in Andhra Pradesh, Tamil Nadu, Karnataka, and Rajasthan, while Tamil Nadu and West Bengal together accounted for almost half of the 1,032.89 sq. km. of gross forest loss.
More significantly, over half of the newly added forest covers are islets, which do not substantially improve structural connectivity. This suggests that even where forest cover is increasing on paper, the ecological value and resilience of those forests may be limited. “Our results clearly show that most of the newly added forests during 2015–2019 were islets, highly fragmented and ecologically vulnerable patches. There is a need to move beyond the current quantity-based afforestation approach and explicitly incorporate structural connectivity into forest planning,” explains Prof. Sathyakumar regarding the implications of the study.
While the findings appear to differ to those of FSI, which often indicate an overall increase in forest cover, the results from FSI and this study are not directly comparable. FSI uses different criteria from the CGLS to identify forests and does not distinguish between fragmented and continuous forests. FSI defines forested areas as those with a minimum of 10% tree canopy cover and relies on satellite imagery with a 23.5 m resolution. In contrast, the CGLS dataset used in this study applies a 15% canopy threshold and a 100 m resolution. The researchers also had to rely on the internationally accepted CGLS dataset, as FSI data are not publicly available for similar analyses. “Since FSI reports do not include forest connectivity assessments, direct comparisons aren’t possible. However, our data source has a globally validated accuracy of over 85%, making our connectivity results reliable. If FSI’s data were made available in GIS-compatible format, our methodology could be readily applied to it,” says Prof. Sathyakumar.
One limitation of the current study is that at 100 m resolution, narrow linear features such as roads and railways may not be fully detected, and forest fragments smaller than 100 m may be missed. However, the strength of the framework lies in its scalability, cost-effectiveness, and use of open-source tools. It can be expected to give consistent results with similar datasets at finer resolutions and can be applied at different spatial and temporal scales.
“Our framework is fully extensible to finer scales, such as districts or protected areas, and can be used to analyse the impacts of linear infrastructure like roads and rail lines on forest connectivity in a more focused manner,” explains Prof. Ramsankaran. This makes it a valuable tool for long-term forest monitoring, planning and informed infrastructure development in and around forested areas, both in India and in similar contexts globally.
In future work, the researchers plan to use the framework to study local causes of fragmentation at finer scales.
*********************************************************
The original academic article, titled Unveiling India’s Forest Cover: Geospatial Perspectives on Structural Connectivity Transitions Across States was written by researchers from IIT Bombay and published in the journal Environmental Monitoring and Assessment, Volume 197.
The original paper can be found here.