RESEARCH SPOTLIGHT
Predicting the Plot: Microbes Hint at Evolution’s Unsolved Question

Credit: Image from Freepix
The following article was originally written by Ms. Divyapriya Chandrasekaran and published here.
Researchers replicate evolution in the lab using microbes and feeding them with subtly different sugars, and observing how their adaptations diverge
In a parallel universe sci-fi plot, a change of one choice leads to endless possibilities. Taking a train to a destination instead of the usual bus unfolds a series of different experiences, but culminates in a logical and predictable ending. Does nature have similar ways? For example, a change in food led to Darwin’s finches adapting their beaks differently. How different do the food sources have to be to push species into different evolutionary outcomes? Can this be achieved even if there are subtle variations in food? And, can we predict the fate of these populations in any way? These fundamental questions in evolutionary biology have baffled scientists for several decades.
Researchers from the Department of Chemical Engineering, Indian Institute of Technology Bombay (IIT Bombay), embarked on understanding this process in the microscopic world. In two of their recent studies, the team used two microbes, a well-known bacterium, Escherichia coli, or E.coli, and a eukaryotic yeast, Saccharomyces cerevisiae, to explore how they process and evolve when identical sugars are served differently. E. coli is a common gut bacterium, and yeast is a common ingredient in baking.
Evolution is how living things change over time, as differences build up over generations. These studies show, for the first time, that subtle variations in otherwise identical environments can lead to evolutionary divergence. For their experiments, the researchers gave a mix of sugars—glucose and galactose, found in dairy products—to one group of microbes. The other groups received either melibiose or lactose, which are complex sugars made up of the same glucose and galactose.
Essentially, the microbial populations were fed equal amounts of glucose and galactose but packaged differently. The food sources are termed as ‘synonymous’, which means they are the same sugars, with subtle variations in their packaging. It is similar to rice and dal versus dosa, the same ingredients with different packaging. The researchers’ team allowed the microbes to multiply for several hundred generations in these three sugar environments, facilitating the evolution process in the microbial world.
“We picked sugars that are chemically related. Our goal was to see if microbes care about how the meal is served,” says Prof Supreet Saini, who led the study from IIT Bombay.
Over generations, subtle variation in the food acts as a fork in the road leading to separate evolutionary paths. After 300 generations, one set of bacteria showed a higher growth rate, while the other group had more biomass (total weight), showing two distinct growth traits. Similar diverged outcomes were observed in yeast groups as well. Based on the sugar composition, each group of microbes adapts into two unpredictable evolutionary paths. The genetic study revealed that several mutations led to this adaptation.
“We didn’t expect these subtle differences (in food/nutrients) to create completely distinct adaptive paths. The findings suggest that the way a cell responds to a nutrient can influence which mutations are beneficial and what paths evolution can take,” shares Neetika Ahlawat, a post-doctoral researcher and author on both studies.
Microbial adaptation to a specific food source can influence their behaviour in a new environment. This spill-over effect is referred to as pleiotropic response or a side effect of adaptation in a given environment. Surprisingly, when the researchers transferred these evolved populations of both E. coli and yeast to a new set of sugar sources, their growth showed a predictable pattern. Thus, while the performance of the populations in the environments in which they were grown was unpredictable, the side effects of evolution could be predicted successfully!
“It’s a nice reminder that evolution is both flexible and constrained. In identical environments, the outcome was unpredictable, demonstrating a possible flexibility in evolution. However, the pleiotrophic side effects of that evolution in new environments were surprisingly consistent. How well an evolved population performed elsewhere could be predicted based on how its ancestor had behaved,” adds Pavithra Venkataraman, a former PhD student at IIT Bombay, and an author of the study on E. coli.
The findings can be scaled to large-scale industrial applications. Tweaking resource combinations may aid in microbes exhibiting beneficial traits. Microbes with improved growth rate and better metabolite yields can be utilised for commercial applications such as food and beverages, pharmaceuticals, and the biofuels industry.
“We could imagine using resources to limit the evolutionary paths available to pathogens, making it harder for antibiotic resistance to emerge. It’s still early days, but the prospect is exciting,” suggests Prof Saini.
Like a fiction story with multiple plots, evolution can create endless variations. Both have commonality: a similar beginning, a tiny twist, and different experiences, with a predictable ending based on the hidden rules. The findings show that we can not only witness the outcome of the game, but also predict it by learning the hidden rules!
*********************************************************
The original academic article, titled Effects of Resource Packaging on the Adaptative and Pleiotropic Consequences of Evolution was written by researchers from IIT Bombay and published in the journal npj|systems biology and applications.
The original paper can be found here.
Could the Cold, Dark Oceans Cool our Data Centres? IIT Bombay Study Finds a Way

The following article was originally written by Mr. Dennis Joy and published here.
A new methodology reveals deep seawater cooling systems can save 79% energy and cut emissions for data centres, with a rapid eight-month payback.
The world’s insatiable appetite for digital services, from streaming movies to e-commerce, is fueling an unprecedented surge in demand for data centres. These digital powerhouses, essential for our connected lives, are also becoming massive energy consumers. According to the International Energy Agency, data centres accounted for approximately 1-1.13% of global electricity consumption in 2022, a figure projected to rise significantly in the coming years. Cooling these server-packed facilities is a significant part of this energy burden, often consuming up to 40% of a data centre’s total energy use. This demand is expected to more than double by 2030, primarily driven by the expansion of Artificial Intelligence. As the planet warms and our digital footprint expands, finding energy-efficient and sustainable cooling solutions is a critical necessity.
In a new study, researchers from the Indian Institute of Technology (IIT) Bombay, under the guidance of Prof Gurubalan Annadurai, have unveiled a comprehensive methodology to assess the feasibility of Deep Seawater Cooling (DSWC) systems, presenting an alternative to conventional, energy-intensive cooling methods. “In deep seawater cooling (DSWC) systems, cold water from deep ocean layers is transported through long pipelines to land-based facilities,” explains Dr. Kashish Kumar, a post-doctoral fellow at IIT Bombay and the lead author of the study. The new study presents a framework that enables the precise calculation of the resources required and the payback period on the investments while implementing a DSWC system based on the prescribed methodology.
While the depths of the ocean offer an easy solution to our cooling needs, transporting large amounts of water over long distances, while maintaining its temperature and rate of flow, can be cost-intensive to both install and operate. “As the cold water travels through warmer upper ocean layers, it can absorb heat and become less effective for cooling. Each segment (of pipeline) is also exposed to harsh marine conditions, including salinity, high pressure, and biological activity (biofouling),” explains Dr. Kumar about the challenges of using DSWC.
To analyse the feasibility of DSWC systems, the researchers developed an eleven-step methodology. First, they established the baseline by specifying a typical data centre’s cooling load (100 MW) and typical operating temperatures, such as a server room temperature of 26-27°C and a supply air temperature of 22°C. They then estimated the power consumption of a conventional chiller-based cooling system, which relies on ambient air as a heat sink, taking into account monthly ambient temperature variations.
Can DSWC replace energy-guzzling cooling systems?
For a DSWC to be feasible, it would have to be as effective as the conventional cooling system, or more, while also being much cheaper to run. To compare, the team analysed the specifics of the DSWC system. They determined the required inlet seawater temperature (18°C) and the necessary mass flow rate (5972.3 kg/s) to meet the cooling demand. The location chosen for the prototype was the Sister Islands, part of the Andaman and Nicobar Islands, for its climatic and oceanographic advantages.
“In tropical oceanic regions, particularly around the equator and extending into low latitudes such as the Andaman and Nicobar Islands, seasonal variations in seawater temperature—especially at depths beyond 100 meters—are minimal. This consistent deep-sea temperature ensures that the DSWC system delivers reliable cooling performance throughout the year, without requiring seasonal modifications or recalibrations,” says Dr. Kumar.
A Thermocline profile of the region, which is a graph showing how seawater temperature changes with ocean depth, provided an accurate picture of the location of the cold water. They used data from the World Ocean Atlas for the specific location, the Sister Islands, to create the thermocline profile. This allowed them to pinpoint the exact depth of 2770 meters where the desired cold water could be found and how that temperature changed with elevation.
The team then utilised General Bathymetric Chart of the Oceans (GEBCO) data to identify the closest horizontal distance from the shore to this depth (2770 meters). This allowed them to calculate the actual pipeline length by accounting for the seabed’s profile, and found it to be around 2784 meters.
For the pipeline itself, High-Density Polyethylene (HDPE) was chosen as the material due to its flexibility, lightweight nature, and resistance to corrosion and UV radiation. The optimal pipeline diameter was determined by balancing two critical factors: erosion velocity and deposition velocity. “Erosion velocity refers to the maximum flow speed of seawater within the pipeline, beyond which the internal pipe walls risk being damaged by friction or particles in the seawater. Deposition velocity is the minimum flow speed required to prevent the accumulation of sediments or salt crystals,” explains Dr Kumar.
This analysis led to an optimal diameter range of 1.286m to 2.06m, with 1.45m identified as the most cost-effective. The thickness of the pipeline was also calculated to ensure it could withstand the external pressure of the deep sea without buckling.
To minimise heat gain as cold seawater travels from the deep ocean to the data centre, the researchers implemented a segmented insulation strategy. This divides the pipeline into sections, each with optimised insulation thickness. According to Dr Kumar, “Each segment receives insulation customised to its specific surrounding temperature. This approach ensures efficient insulation use, reduces heat gain, and optimises costs.”
Once these factors were calculated, the team could estimate the pump power consumption, a significant operational cost for DSWC, which measured the energy required to run the DSWC system. Finally, they could compare the energy consumption between DSWC and conventional systems.
Efficient cooling and environmentally friendly
Their findings show that when applied to a data centre with a 100 MW cooling load in a tropical region like the Andaman and Nicobar Islands, a DSWC system could achieve an impressive annual energy saving of 79%. Furthermore, the approach promises substantial environmental benefits, including over 79% annual reduction in carbon dioxide emissions.
More importantly, the framework boasts an astonishingly quick payback period. Assuming a cooling load of 100 MW, an average electricity rate of $0.0851 per kWh, and an operating time of 8760 hours/year, payback will take just eight months. This considers the maintenance cost to be 25% of capital cost annually and a discount rate of 6.75%, with significant investments being the pipeline itself, insulation, heat exchangers, and air ducting.
However, the researchers acknowledge certain limitations. Their study relies on some simplifying assumptions, such as fixed supply air temperature and heat exchanger performance based on standard guidelines, which might vary in real-world scenarios. The system also performs economically and operationally better in coastal regions with easy access to the deep ocean cold water. Further from the location of the cold water can increase installation and operational costs. Future research could benefit from more precise mapping of thermocline layers and seabed profiles, a deeper understanding of HDPE pipeline erosion velocities, and long-term studies on component degradation.
Nevertheless, the framework developed allows for investors to carefully assess the economic and technical feasibility of switching from conventional to DSWC systems. While the study emphasises data centre cooling, the standardised methodology is adaptable for various sectors, especially those with large, continuous cooling or heating demands. According to Dr Kumar, some potential beneficiaries could be “hospital complexes that require 24×7 cooling with minimal downtime, cooling for residential/commercial buildings in tropical coastal cities, Industrial Processing Units and Integrated Desalination and Cooling systems.”
By harnessing the naturally cold temperatures of the deep ocean, DSWC systems can alleviate strain on electrical grids, lower operational costs for businesses, and contribute substantially to reducing greenhouse gas emissions. By providing a clear, systematic methodology for DSWC implementation, this study paves the way for broader adoption of a cooling solution that is not only energy-efficient and economically viable but also crucial for building a more sustainable digital future.
“Developing nations may benefit immensely, particularly island nations and coastal regions. However, international cooperation, technology transfer, and targeted policy support (e.g., green finance or infrastructure subsidies) are essential for scalability,” concludes Dr Kumar.
*********************************************************
The original academic article, titled Methodology to Analyze the Feasibility of Deep Seawater Cooling Systems was written by researchers from IIT Bombay and published in the journal Renewable Energy, Volume 252.
The original paper can be found here.
A Novel Mathematical Model To Test Traffic Control Algorithms

Image Credit: Needpix.com
The following article was originally written by Mr. ArulGanesh SS and published here.
Researchers from IIT Bombay propose a computationally efficient, network theory-based mathematical framework to test decentralised traffic control systems.
Have you ever wondered how city traffic would look without traffic control? Traffic control systems, such as the traffic lights at intersections, play a crucial role in bringing order to what would otherwise be chaotic streets. The better these systems are at managing vehicle movement, the smoother our drives and the shorter our wait times.
Thanks to ongoing research, these systems are getting smarter. New algorithms, including those based on machine learning as well as improved traditional methods, are being developed to tackle the growing challenge of urban congestion. However, it is important to test and validate the performance of these newer algorithms before deploying them in the real world. Poorly designed or malfunctioning traffic signals could create more problems than having no signals at all, making careful evaluation essential to ensure safer and more efficient traffic flow.
In one such effort, a recent study by Dr. Namrata Gupta and Prof. Gopal R. Patil from the Indian Institute of Technology Bombay (IIT Bombay), in collaboration with Prof. Hai L. Vu from Monash University, Australia, introduces a new framework to evaluate certain traffic control systems. The framework does not rely heavily on expensive simulations and uses fewer computational resources.
Traffic across a city could be controlled centrally, through a single control centre, or a decentralised system could be used, where traffic at each intersection is controlled locally. Centralised systems that make decisions using data from the entire road network can potentially yield shorter travel times and reduced congestion. However, they demand significant resources, and any system-wide failure can bring city traffic to a halt. In contrast, decentralised systems use local cues and feedback, making them cheaper, easier to implement and less likely to cause large-scale disruptions.
Computer simulations of traffic are often employed to test traffic control systems. However, detailed computer simulations of traffic are often costly and time-consuming. Even if one employs very resource-intensive simulations, it may not be possible to anticipate and model all possible real-world scenarios. The approach developed by IIT Bombay researchers tries to address this challenge by using mathematical models from network theory.
This novel approach introduces two metrics to evaluate traffic control policies. Both metrics can be computed by simulating the policy on what are known as two-bin network systems. The simulation requires much less computing power and time. The first metric measures how effectively a policy can avoid gridlock, where traffic in any direction comes to a halt. It indicates the ability of a policy to evenly spread vehicles across different directions and ensure smooth flow. The second metric captures how quickly a policy can clear traffic jams. “Our proposed metrics can be applied to any traffic control policy, including those based on machine learning, provided the policy can be adapted to the structure of the two-bin model,” says Prof. Patil.
Traffic policies, whether traditional algorithm-based or AI-driven, that aim to balance vehicle volumes and flows between two main directions can be modelled using the two-bin approach. The approach treats each direction as a separate ‘bin’ and a change in direction of vehicles as a flow from one bin to another.
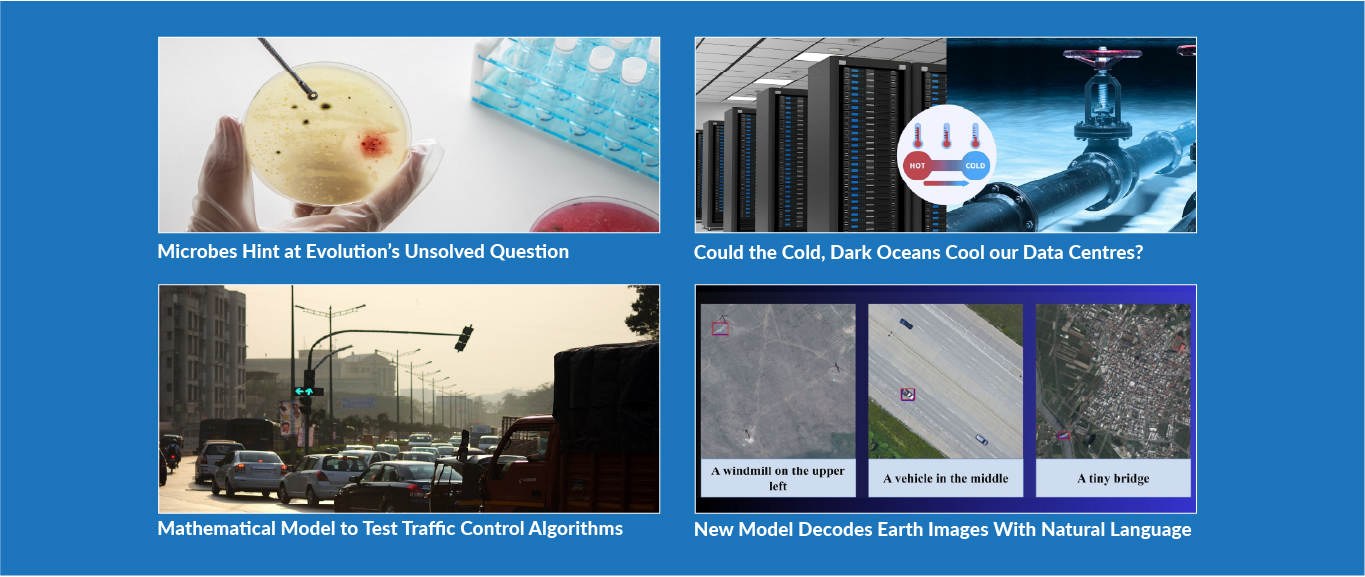
In the current study, the researchers consider road networks that are structured as rectangular grids, similar to those seen in planned cities like Chandigarh. The streets are grouped in two different bins: those running along the north-south direction (N-S) in one bin and those running along the east-west direction (E-W) in another. The change of direction of vehicles from N-S to E-W is represented as a flow from the N-S bin to the E-W bin and vice versa. This two-bin approach helps translate the road network and traffic flow into mathematical equations, namely ordinary differential equations. By solving these, researchers determine the best-possible flow conditions, and also obtain what is known as the macroscopic fundamental diagram (MFD) of traffic flow. The MFD describes relationships between average vehicle speed, average density, and average traffic flow at the network level, helping us understand traffic behaviour and congestion under different vehicular loads.
Image Credits: Authors of the study
The theoretical results from this analysis set a benchmark, the best results possible for traffic flow within a two-bin system. Any traffic policy, then, can be simulated within the two-bin model and compared to this theoretical maximum. Policies that come closer to this ideal are considered more effective. The proposed metrics measure how close a given policy is to this maximum.
A major advantage of this framework is its efficiency. Network performance can be calculated based on just a few simple equations, without laboriously modelling every single car and intersection. “The two-bin model is a macroscopic abstraction, governed by two simple ordinary differential equations. We can obtain network optimal performance theoretically. Further, this model requires much less computation, enabling rapid evaluation of multiple traffic scenarios,” explains Dr. Gupta. The researchers also validated their method by simulating traffic policies using the commonly used traffic simulator PTV VISSIM.
Even though the method appears robust, it cannot simulate every possible traffic state. “While it is impossible to simulate all possible traffic states, we incorporate such theoretical results to design diverse scenarios that include variations in congestion levels, demand patterns, and network configurations, which are chosen to reflect diverse operating conditions,” clarifies Prof. Patil.
Another limitation of the framework is that it cannot be applied effectively to complex road networks. More complex abstractions like four-bin systems can potentially model complex road networks. In another work, the same team has extended this framework to three-bin models. Incorporating pedestrians is another challenge. “Extending these bin-based models to capture pedestrians is not straightforward. Pedestrian movement is governed by different dynamics and constraints compared to vehicular flow,” explains Dr. Gupta.
Looking forward, the researchers hope to link their new performance metrics to familiar quantities such as travel time and waiting time, making the findings even more practical. They are also exploring whether the theoretical insights from the two-bin model can encourage new machine learning approaches for traffic management, including signal controllers based on physics-inspired reinforcement learning.
*********************************************************
The original academic article, titled A Simple Methodology for Evaluating the Robustness of Decentralised Traffic Signal Controllers was written by researchers from IIT Bombay and published in the journal Transportmetrica B: Transport Dynamics.
The original paper can be found here.
Say It, Spot It: New Model Decodes Earth Images With Natural Language
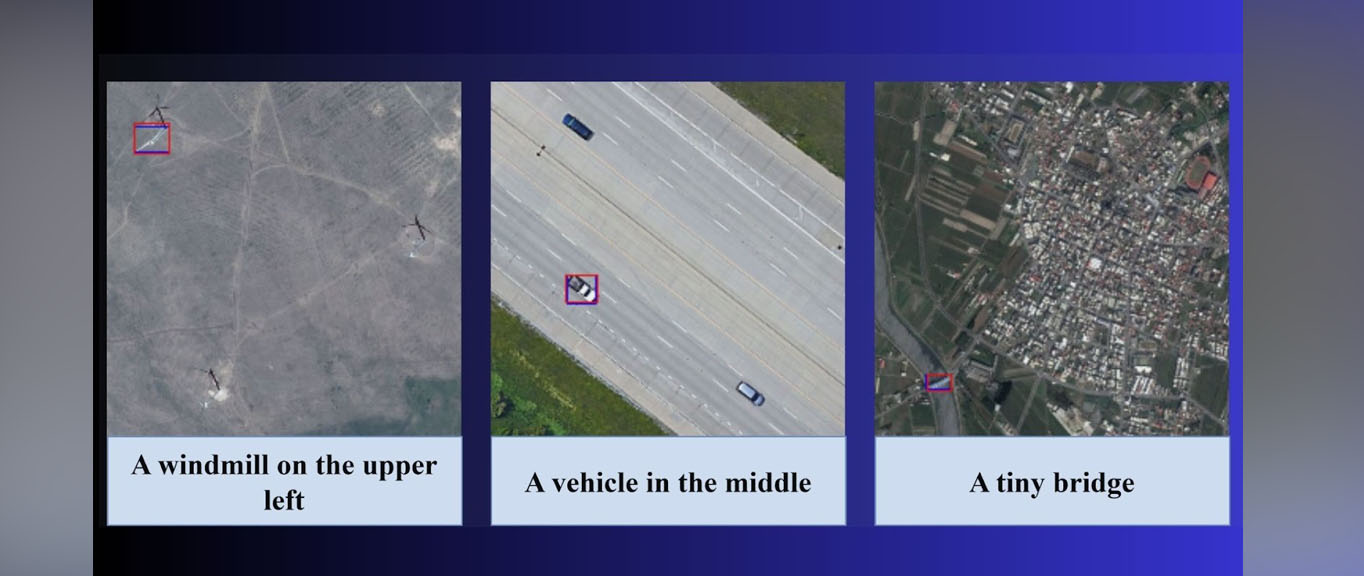
Remote sensing images with the identified object inside the box and query text below.
Image Credits: Authors of the study
The following article was originally written by Deekshith Pinto and published here.
IIT Bombay researchers build a new model, named AMVG, that bridges the gap between how humans prompt and how machines analyse satellite or remote sensing imagery.
Taking a photo of your living room and asking an artificial intelligence (AI) tool to spot your cat or TV remote may seem like a cool trick. And you’d be surprised how often it gets it right. But for complex satellite or drone images, most state-of-the-art models failed to identify objects reliably with natural language prompts. Until now!
Researchers from the Indian Institute of Technology, Bombay (IIT Bombay), led by Prof Biplab Banerjee, have now developed a new model to address natural language object identification in remote sensing images. Named Adaptive Modality-guided Visual Grounding (AMVG), the proposed framework not only recognises what’s in the image, but also understands what the user is asking, even when the prompts are ambiguous or contextual.
Take, for example, a command like ‘find all damaged buildings near the flooded river’. Humans can fairly reliably execute this command. But to scan through hundreds of cluttered images within minutes, it’s crucial to train machines to analyse remote sensing data with a similar or better accuracy. This process of training a computer to understand descriptions in everyday language and match them with details in images is called visual grounding or phrase grounding.
“Remote sensing images are rich in detail but extremely challenging to interpret automatically. While visual grounding has progressed significantly, current models fail to transfer effectively to remote sensing scenarios, especially when the commands are ambiguous or context-dependent,” explains Shabnam Choudhury, the study’s lead author and a PhD researcher at IIT Bombay.
With every passing year, the volume of such remote sensing data continues to grow exponentially. Captured from large distances above Earth (think of satellites, drones, aircraft), these images are cluttered with tiny objects, atmospheric noise, and scale variations. In these images, a building may appear like a runway and a runway like a river. The IIT Bombay study, published in the ISPRS Journal of Photogrammetry and Remote Sensing, demonstrates how AMVG acts like a sophisticated translation system, interpreting prompts in everyday human language and identifying objects reliably.
But, how did the IIT Bombay researchers achieve this feat? Choudhury explains that most models today employ a two-step method for visual grounding: first, they propose regions, and then they rank them. AMVG, on the other hand, uses the four key innovations, namely the Multi-modal Deformable Attention layer, Multi-stage Tokenised Encoder (MTE), Multi-modal Conditional Decoder, and Attention Alignment Loss (AAL).
The first layer helps AMVG to smartly prioritise regions for the specific query instead of analyzing every pixel equally. The second, MTE, acts like a skilled refiner and interpreter, adapting to difficult prompts step-by-step while aligning features and descriptions. The third, Multi-modal Conditional Decoder, progressively refines the model’s search rather than making a single guess. Think of it like a detective narrowing down suspects by eliminating possibilities. Fourth, and perhaps the most ingenious feature of the model is a new training objective called the Attention Alignment Loss (AAL). This innovative training technique sounds almost philosophical, acting as a teacher guiding a student’s focus.
“Think of AAL like a coach. When a human reads ‘the white truck beside the fuel tank’, their eyes know where to look in an image. AMVG, being a machine, needs help developing that intuition. AAL does exactly that: it teaches the model where to look. If the model’s “attention” drifts too far, AAL gently nudges it back,” Choudhury explains. Together, these four components enable AMVG to “see with context” and “listen with nuance”, setting it miles apart from previous such attempts.
This is not just technological progress. The real-world implications of this model range from disaster response and military surveillance to urban planning and agricultural productivity.
“One of the most exciting applications for us is disaster response,” Choudhury notes. During a flood, earthquake, or wildfire, responders could simply ask the model: ‘Show damaged buildings beside the highway’ and receive precise coordinates. Similarly, even for army personnel trying to
‘spot camouflaged vehicles in dense terrain near the border’ or a farmer aiming to ‘find yellowing crop patches near irrigation lines’, the model can offer real-time insights.
Importantly, the researchers have open-sourced the entire model, making AMVG’s complete implementation publicly available on GitHub. This is a rare move in remote sensing research, say the researchers.
“While open-sourcing is becoming more common in the natural image visual grounding community, it’s still relatively rare in the remote sensing space. Many state-of-the-art RS models remain closed or only partially released, which slows down collective progress,” reveals Choudhury.
“Open-sourcing AMVG was a deliberate choice, and a deeply personal one too. We believe that real scientific impact happens when your work doesn’t just sit behind a paywall. By publishing our framework end-to-end, we’re hoping to encourage transparency, reproducibility, and rapid iteration in remote sensing-visual grounding research,” she adds.
Of course, no model is perfect. AMVG still depends on the availability of high-quality, annotated datasets. Its performance may vary across sensors or regions it hasn’t seen before. Although it’s more efficient than previous models, deploying it in real-time or on edge devices needs further optimisation.
But the direction is clear. The team is already working on sensor-aware versions, compositional visual grounding (e.g., “the small hut behind the blue tank near the tree”), and large vision-language models to generalise across sensors, geographies, and tasks.
“Ultimately, we want to push toward a unified RS (remote sensing) understanding system that can ground, describe, retrieve, and reason about any image, in any modality, using natural language,” says Choudhury.
IIT Bombay’s AMVG is not just technically superior, but has the potential to make remote sensing truly accessible for large-scale, real-world applications. By bridging the gap between how we speak and how machines spot, it brings complex Earth observation tools within reach of those who need them most, enabling our journey towards a world that is better planned and better prepared.
*********************************************************
The original academic article, titled Improving Visual Grounding in Remote Sensing Images with Adaptive Modality Guidance, was written by researchers from IIT Bombay and published in the journal ISPRS Journal of Photogrammetry and Remote Sensing,
Volume 224, June 2025.
The original paper can be found here.